


Traditional Kubernetes deployments replace an old application version with a new one and declare success when the new Pods become ready. That works—until a release is technically “ready” but is returning more errors, timing out under real traffic, or breaking a critical user journey.
Progressive delivery adds controlled exposure, measurement, and automated decision-making to the release process. Instead of sending every request to a new version at once, we introduce it gradually, validate its behavior, and either promote it or restore the known-good version.
In this guide, we will build that workflow using:
- Helm to package the Kubernetes resources.
- ArgoCD to reconcile the cluster with Git.
- Argo Rollouts to manage the canary and promotion process.
- Prometheus to determine whether the canary is healthy.
The result is a GitOps-driven release with explicit traffic steps, measurable acceptance criteria, and an automatic rollback path.
The delivery model
The workflow has a clear separation of responsibilities:
- CI builds and tests the application image.
- CI writes the immutable image tag to the Helm values stored in Git.
- ArgoCD detects the commit and synchronizes the desired state.
- Argo Rollouts creates a canary ReplicaSet alongside the stable one.
- Traffic moves to the canary in controlled increments.
- Prometheus evaluates the canary during the rollout.
- Argo Rollouts promotes a healthy revision or aborts a failed one.
Git remains the source of truth, while the rollout controller makes runtime safety decisions inside boundaries defined in Git.
Prerequisites
You need a Kubernetes cluster and the following command-line tools:
kubectl version --client
helm version
argocd version --client
kubectl argo rollouts version
The examples use the demo-api namespace and assume Prometheus is reachable at http://prometheus-server.monitoring.svc.cluster.local.
Use immutable image tags such as a Git SHA. Reusing
latestmakes auditing and rollback unnecessarily difficult.
1. Install Argo Rollouts
kubectl create namespace argo-rollouts
kubectl apply -n argo-rollouts \
  -f https://github.com/argoproj/argo-rollouts/releases/latest/download/install.yaml

kubectl wait --for=condition=Available \
  deployment/argo-rollouts \
  -n argo-rollouts \
  --timeout=180s
Install the dashboard locally when you want a visual view of the rollout:
kubectl argo rollouts dashboard
This exposes a local dashboard without making it publicly reachable from the cluster.
2. Structure the Git repository
Keep the chart and environment-specific configuration easy to find:
platform-config/
├── applications/
│   └── demo-api.yaml
└── charts/
    └── demo-api/
        ├── Chart.yaml
        ├── values.yaml
        └── templates/
            ├── rollout.yaml
            ├── services.yaml
            └── analysis-template.yaml
The minimal Chart.yaml is straightforward:
apiVersion: v2
name: demo-api
description: Progressive delivery example with Argo Rollouts
type: application
version: 0.1.0
appVersion: "1.0.0"
Define the image, rollout steps, and analysis settings in values.yaml:
image:
  repository: ghcr.io/example/demo-api
  tag: "a1b2c3d"
  pullPolicy: IfNotPresent

replicaCount: 6

service:
  port: 80
  targetPort: 3000

rollout:
  maxSurge: 1
  maxUnavailable: 0
  steps:
    - setWeight: 10
    - pause: { duration: 2m }
    - setWeight: 25
    - pause: { duration: 5m }
    - setWeight: 50
    - pause: { duration: 10m }
These pauses are observation windows, not arbitrary delays. Tune them to your traffic volume and the time required to produce trustworthy metrics.
3. Create stable and canary Services
Argo Rollouts switches the selectors on these Services as revisions change:
apiVersion: v1
kind: Service
metadata:
  name: demo-api-stable
spec:
  ports:
    - port: 80
      targetPort: 3000
  selector:
    app.kubernetes.io/name: demo-api
---
apiVersion: v1
kind: Service
metadata:
  name: demo-api-canary
spec:
  ports:
    - port: 80
      targetPort: 3000
  selector:
    app.kubernetes.io/name: demo-api
For precise request-level traffic splitting, connect the rollout to a supported traffic router such as Istio, NGINX, AWS ALB, or another provider supported by Argo Rollouts. Without a traffic router, setWeight approximates the percentage by scaling ReplicaSets.
4. Replace Deployment with Rollout
A Rollout resembles a Deployment but adds a delivery strategy:
apiVersion: argoproj.io/v1alpha1
kind: Rollout
metadata:
  name: demo-api
spec:
  replicas: {{ .Values.replicaCount }}
  revisionHistoryLimit: 3
  strategy:
    canary:
      stableService: demo-api-stable
      canaryService: demo-api-canary
      maxSurge: {{ .Values.rollout.maxSurge }}
      maxUnavailable: {{ .Values.rollout.maxUnavailable }}
      analysis:
        templates:
          - templateName: demo-api-success-rate
        startingStep: 1
      steps:
{{ toYaml .Values.rollout.steps | indent 8 }}
  selector:
    matchLabels:
      app.kubernetes.io/name: demo-api
  template:
    metadata:
      labels:
        app.kubernetes.io/name: demo-api
    spec:
      containers:
        - name: api
          image: "{{ .Values.image.repository }}:{{ .Values.image.tag }}"
          imagePullPolicy: {{ .Values.image.pullPolicy }}
          ports:
            - containerPort: 3000
          readinessProbe:
            httpGet:
              path: /ready
              port: 3000
            periodSeconds: 5
            failureThreshold: 3
          livenessProbe:
            httpGet:
              path: /health
              port: 3000
            periodSeconds: 10
            failureThreshold: 3
          resources:
            requests:
              cpu: 100m
              memory: 128Mi
            limits:
              cpu: 500m
              memory: 512Mi
maxUnavailable: 0 prevents the rollout from deliberately reducing available capacity during the transition. The readiness probe prevents unready Pods from receiving traffic, but it does not prove that a release is safe. That is the job of the analysis.
5. Define a Prometheus analysis
The following AnalysisTemplate checks the proportion of successful requests. Adapt the metric names and labels to your instrumentation:
apiVersion: argoproj.io/v1alpha1
kind: AnalysisTemplate
metadata:
  name: demo-api-success-rate
spec:
  metrics:
    - name: success-rate
      interval: 1m
      count: 5
      failureLimit: 1
      successCondition: result[0] >= 0.99
      provider:
        prometheus:
          address: http://prometheus-server.monitoring.svc.cluster.local
          query: |
            sum(
              rate(http_requests_total{
                app="demo-api",
                status!~"5.."
              }[2m])
            )
            /
            sum(
              rate(http_requests_total{
                app="demo-api"
              }[2m])
            )
The metric succeeds when at least 99% of requests are not server errors. A production policy usually combines multiple signals—for example success rate, latency, saturation, and a business-critical operation.
Guard against missing data. A query returning no series should not accidentally be interpreted as a healthy result. Test the exact query before attaching it to an automated rollback decision.
6. Let ArgoCD manage the release
Create an ArgoCD Application pointing to the chart:
apiVersion: argoproj.io/v1alpha1
kind: Application
metadata:
  name: demo-api
  namespace: argocd
spec:
  project: default
  source:
    repoURL: https://github.com/example/platform-config.git
    targetRevision: main
    path: charts/demo-api
  destination:
    server: https://kubernetes.default.svc
    namespace: demo-api
  syncPolicy:
    automated:
      prune: true
      selfHeal: true
    syncOptions:
      - CreateNamespace=true
Apply it once:
kubectl apply -f applications/demo-api.yaml
argocd app wait demo-api --health --sync --timeout 300
The Application Details Tree brings the entire release into one view: the Git revision, sync result, application health, Services, Rollout, ReplicaSets, Pods, and AnalysisRun.
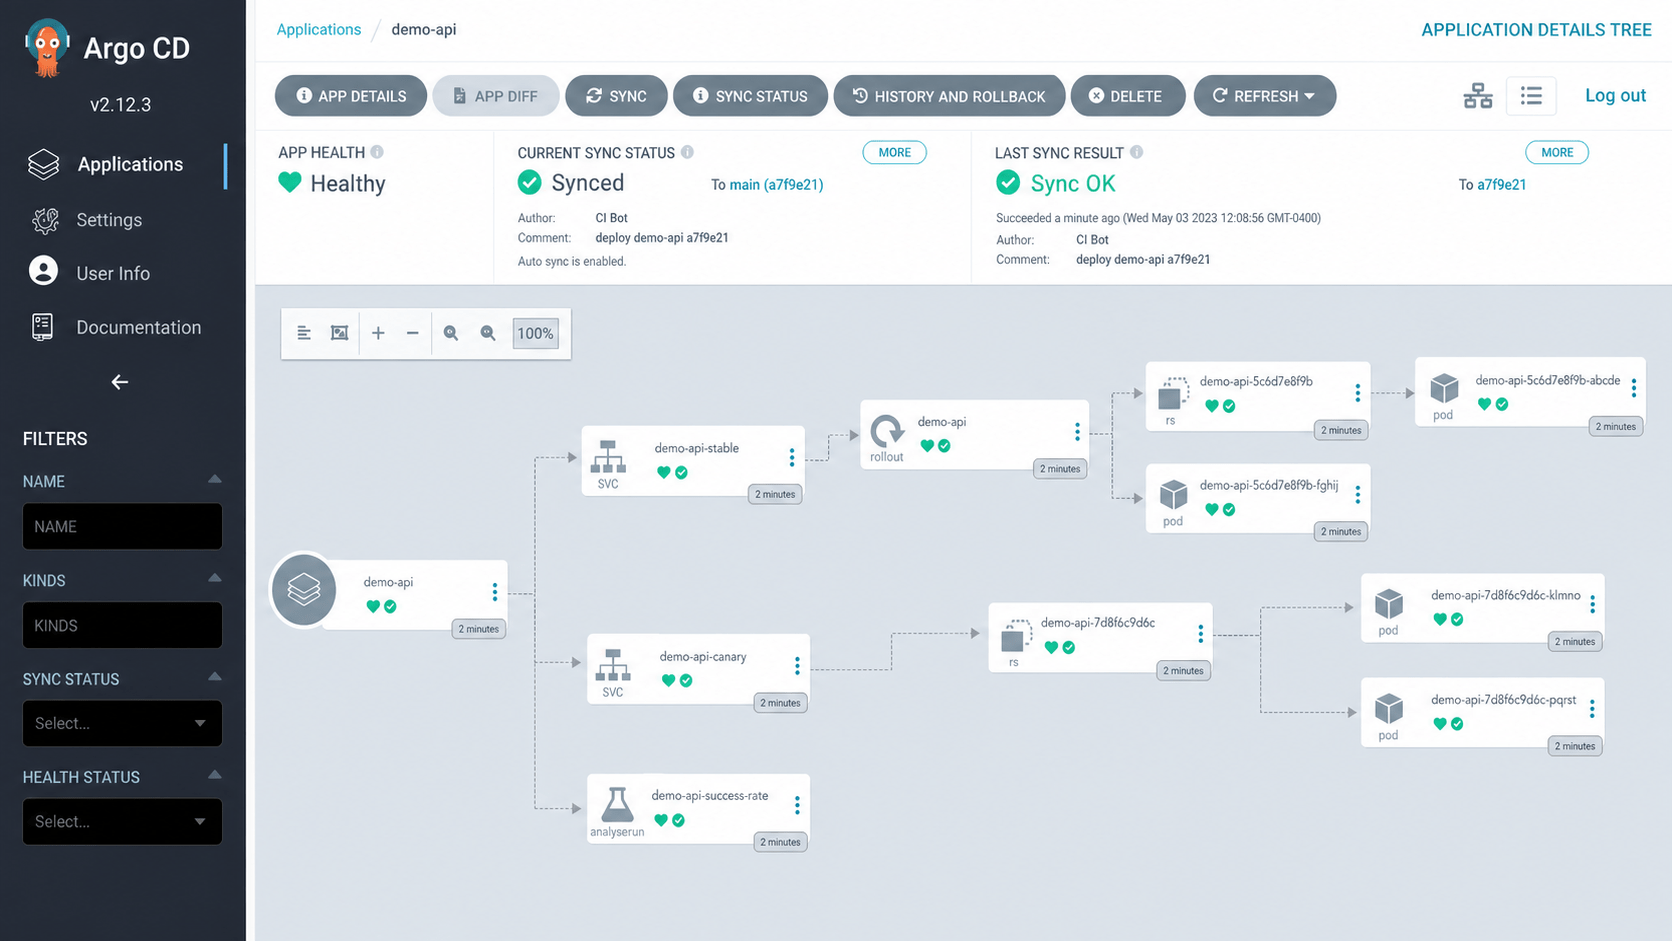
demo-api after a successful GitOps sync.From this point onward, change the image tag in Git instead of modifying the Rollout directly with kubectl. Direct cluster edits create drift and weaken the audit trail.
7. Trigger and observe a canary
Update the image tag, commit, and push:
git checkout -b release/demo-api-a7f9e21
sed -i 's/tag: "a1b2c3d"/tag: "a7f9e21"/' charts/demo-api/values.yaml
git add charts/demo-api/values.yaml
git commit -m "deploy demo-api a7f9e21"
git push origin release/demo-api-a7f9e21
After the change reaches the tracked branch, watch the rollout:
kubectl argo rollouts get rollout demo-api \
  -n demo-api \
  --watch

At the first step, most traffic remains on the stable revision while the new revision receives enough traffic to produce a meaningful signal. The analysis runs during the configured observation window.
Useful inspection commands include:
kubectl get analysisruns -n demo-api
kubectl describe analysisrun -n demo-api <analysis-run-name>
kubectl argo rollouts status demo-api -n demo-api --timeout 10m
For a manual gate, use an indefinite pause in the steps and promote only after review:
kubectl argo rollouts promote demo-api -n demo-api
Use manual promotion sparingly. A repeatable, well-instrumented service should gradually move toward automated acceptance criteria.
8. Test the failure and rollback path
A delivery system is not trustworthy until its failure behavior has been exercised. Deploy a test revision that produces controlled HTTP 500 responses or deliberately tighten the analysis threshold in a non-production environment.
When the error rate violates the policy, the AnalysisRun fails and the Rollout enters a degraded state:
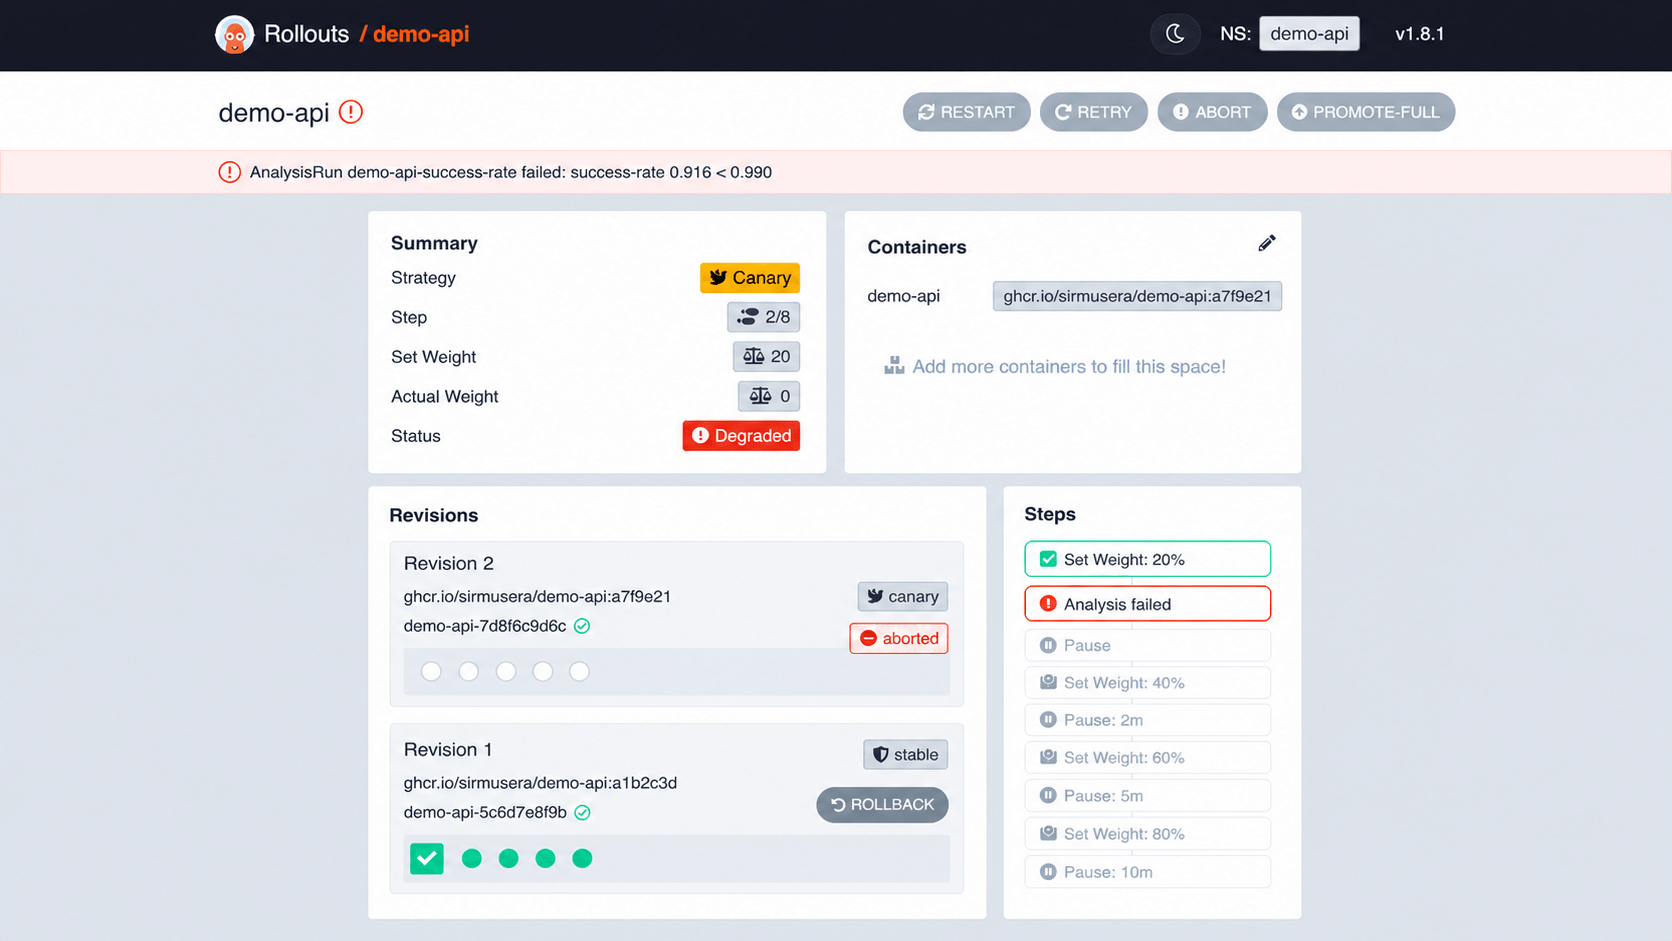
Abort a rollout manually when human judgment identifies a problem not covered by the automated metrics:
kubectl argo rollouts abort demo-api -n demo-api
Verify the outcome:
kubectl argo rollouts get rollout demo-api -n demo-api
kubectl get rs -n demo-api -l app.kubernetes.io/name=demo-api
kubectl get analysisruns -n demo-api
The important measure is not merely whether rollback exists. Measure the time from the first bad signal to restored stable traffic. That is the practical recovery time experienced by users.
Production hardening checklist
Before using this pattern for critical workloads, confirm the following:
- Images use immutable tags or digests.
- Readiness and liveness probes represent different failure modes.
- PodDisruptionBudgets preserve capacity during node disruption.
- CPU and memory requests are based on measurements.
- Analysis queries have been tested with healthy, unhealthy, and missing data.
- Canary traffic is large enough to produce statistically useful signals.
- Rollout notifications reach the incident and engineering channels.
- ArgoCD projects restrict repositories, destinations, and resource types.
- ArgoCD and Argo Rollouts permissions follow least privilege.
- Rollback behavior is tested regularly outside production.
- Dashboards and runbooks link directly to the Rollout and AnalysisRun.
- CI updates Git; it does not need broad write access to the cluster.
Common mistakes
Treating readiness as a release-quality signal
Readiness only answers whether Kubernetes may route traffic to a Pod. It does not measure user-visible error rates, latency, or correctness.
Using pauses without defining what will be evaluated
A ten-minute pause adds no safety if nobody and nothing examines the release. Pair every observation window with a specific automated analysis or human decision.
Evaluating only cluster health
CPU, memory, and Pod restarts matter, but a healthy cluster can still serve a broken product. Include request and business-level indicators.
Allowing ArgoCD and the rollout controller to fight
Keep desired rollout structure in Git and let Argo Rollouts manage the live ReplicaSets and traffic progression. Avoid CI jobs that issue competing imperative changes.
Calling every regression a rollback problem
Rollback restores the earlier application version; it does not reverse incompatible database migrations or external side effects. Use backward-compatible schema changes and expand-and-contract migrations.
Final thoughts
Helm, ArgoCD, and Argo Rollouts solve different parts of the same delivery problem. Helm describes the package, ArgoCD continuously reconciles Git with the cluster, and Argo Rollouts controls exposure of the new revision.
The value is not a more elaborate deployment animation. The value is a release process that makes risk explicit: small exposure, measurable evidence, fast promotion, and a tested path back to safety.
Start with one service and one dependable metric. Exercise a failed release deliberately, measure recovery time, and improve the process from what you observe. Progressive delivery becomes valuable when teams trust it enough for deployments to become routine—and deliberately boring.


Leave a Comment
Your email address will not be published. Required fields are marked with *